If you’ve ever slowed down at a traffic signal or walked past a construction site in Mumbai, you’ve likely noticed a bright LED board flashing numbers in red, blue, and green.
Most people glance at it and move on. Few realize that this small screen is quietly revealing how clean—or polluted—the air around you is at that very moment.
What Exactly Is This Display?
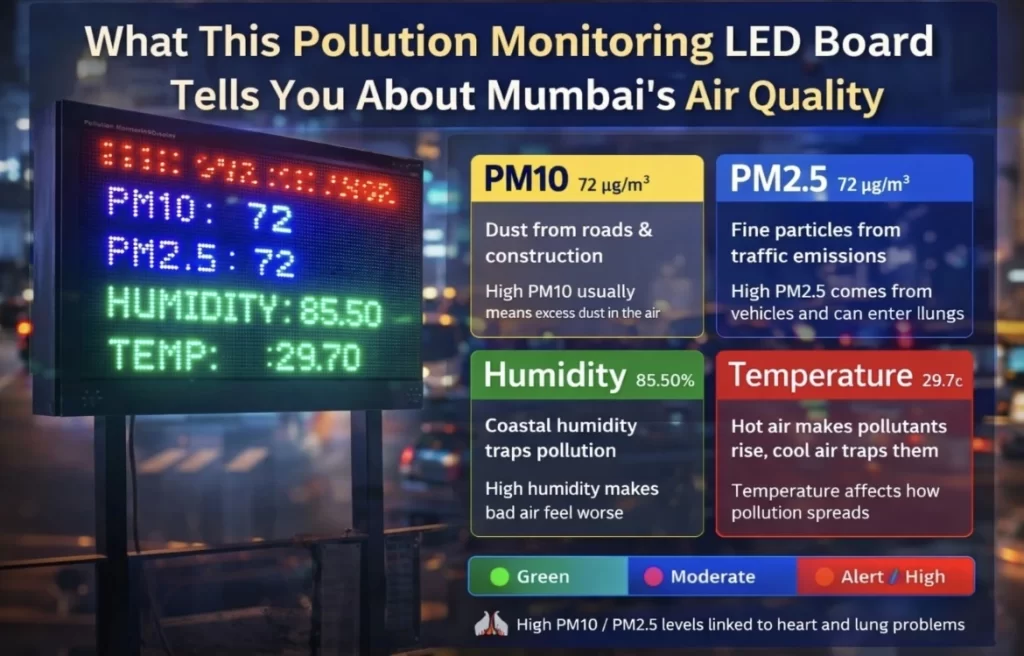
The board is a Real-Time Air Pollution Monitoring Display, connected to sensors installed at construction sites, road projects, and infrastructure zones.
What it does:
- Continuously samples surrounding air
- Measures dust and fine particles
- Displays live environmental data
- Updates automatically every few minutes
Unlike mobile apps that show city-wide averages, this board shows hyperlocal air quality—the air you’re breathing right there.
Why Mumbai Needs These Boards
Mumbai’s pollution is different from North India’s smog problem. It’s less visible, but often more persistent.
Major pollution sources in Mumbai:
| Source | Impact |
| Construction & redevelopment | High PM10 (dust) |
| Traffic congestion | High PM2.5 |
| Diesel generators | Fine toxic particles |
| Coastal humidity | Traps pollutants |
| Road dust | Continuous exposure |
Because of this, authorities mandate on-site pollution monitoring for large projects, making pollution visible and accountable.
Decoding the Numbers on the Screen
Let’s break down each parameter you typically see on the display.
PM10 – The Dust Indicator
What it measures:
Coarse particles up to 10 microns in size.
Common sources in Mumbai:
- Construction debris
- Road dust
- Metro and flyover work
- Open soil and sand
PM10 Reading Guide
| PM10 (µg/m³) | What It Means |
| 0–50 | Good |
| 51–100 | Satisfactory |
| 101–250 | Moderate to Poor |
| 251+ | Very Poor |
High PM10 almost always means dust, not smoke. If you see PM10 rising near a site, dust-control measures may be lacking.
PM2.5 – The Invisible Threat
What it measures:
Extremely fine particles that penetrate deep into the lungs and bloodstream.
Main Mumbai sources:
- Vehicle exhaust
- Diesel generators
- Industrial emissions
- Traffic bottlenecks
PM2.5 Reading Guide
| PM2.5 (µg/m³) | Health Category |
| 0–30 | Good |
| 31–60 | Satisfactory |
| 61–90 | Moderate |
| 91–120 | Poor |
| 121+ | Very Poor |
Why PM2.5 matters more:
Even when the sky looks clear, PM2.5 can be high—and it’s strongly linked to heart and lung disease.
Temperature – More Than Just Heat
What it shows:
Ambient air temperature.
Why it matters in Mumbai:
- Hot air can disperse pollutants upward
- Cooler nights trap pollution closer to ground
- Temperature affects how long particles stay airborne
Humidity – The Hidden Multiplier
Mumbai’s coastal location means humidity is almost always high.
Typical Mumbai humidity levels:
- Monsoon: 80–95%
- Winter mornings: 70–85%
- Summer afternoons: 60–75%
Why humidity matters:
- Traps pollutants
- Makes air feel heavier
- Worsens breathing discomfort
Example Effect
| PM2.5 | Humidity | How It Feels |
| 60 | 40% | Mild |
| 60 | 85% | Uncomfortable, heavy air |
Understanding the Colors on the Board
Most boards use color-coding for quick interpretation.
| Color | Meaning |
| 🟢 Green | Acceptable |
| 🔵 Blue | Moderate |
| 🔴 Red | High / Alert |
When values flash in red, it often indicates:
- Pollution threshold crossed
- Immediate dust-control actions required
- Possible violation if prolonged
How to Read the Board Like a Local
Here’s a quick Mumbai-specific interpretation guide:
| Pattern You See | What It Likely Means |
| High PM10, normal PM2.5 | Dust from construction |
| High PM2.5 near traffic | Vehicle pollution |
| Both PMs high | Serious air quality issue |
| Moderate PM + high humidity | Air feels worse than numbers |
Is This the Same as AQI?
No—but it’s related.
| AQI Apps | Display Board |
| City-wide average | Hyperlocal |
| Delayed updates | Near real-time |
| Forecast-based | Sensor-based |
Think of the board as a live weather report for pollution—right where you stand.
Why These Boards Matter More Than Ever
Air pollution isn’t just an environmental issue—it’s a daily health exposure.
Long-term exposure is linked to:
- Asthma and allergies
- Reduced lung capacity
- Heart disease
- Higher risk for children and elderly
By displaying pollution publicly, these boards:
- Increase transparency
- Pressure sites to comply
- Help citizens make informed choices
The Takeaway
That glowing screen on Mumbai’s streets isn’t background noise—it’s a real-time report card of the city’s air.
Once you know how to read it, you’ll start noticing patterns:
- Cleaner air after rainfall
- Dust spikes during road work
- PM2.5 surges during rush hour
In a city that never slows down, these boards quietly remind us of something essential:
Every number is a breath.
Leave a Reply